Arima Bioinformatics Platform
The Arima Bioinformatics Platform is an online, user friendly platform designed for the analysis of Hi-C data. Currently, there are two pipelines on the platform: a QC pipeline for shallow-seq SV Hi-C data, and the Arima SV pipeline for structural variant detection.
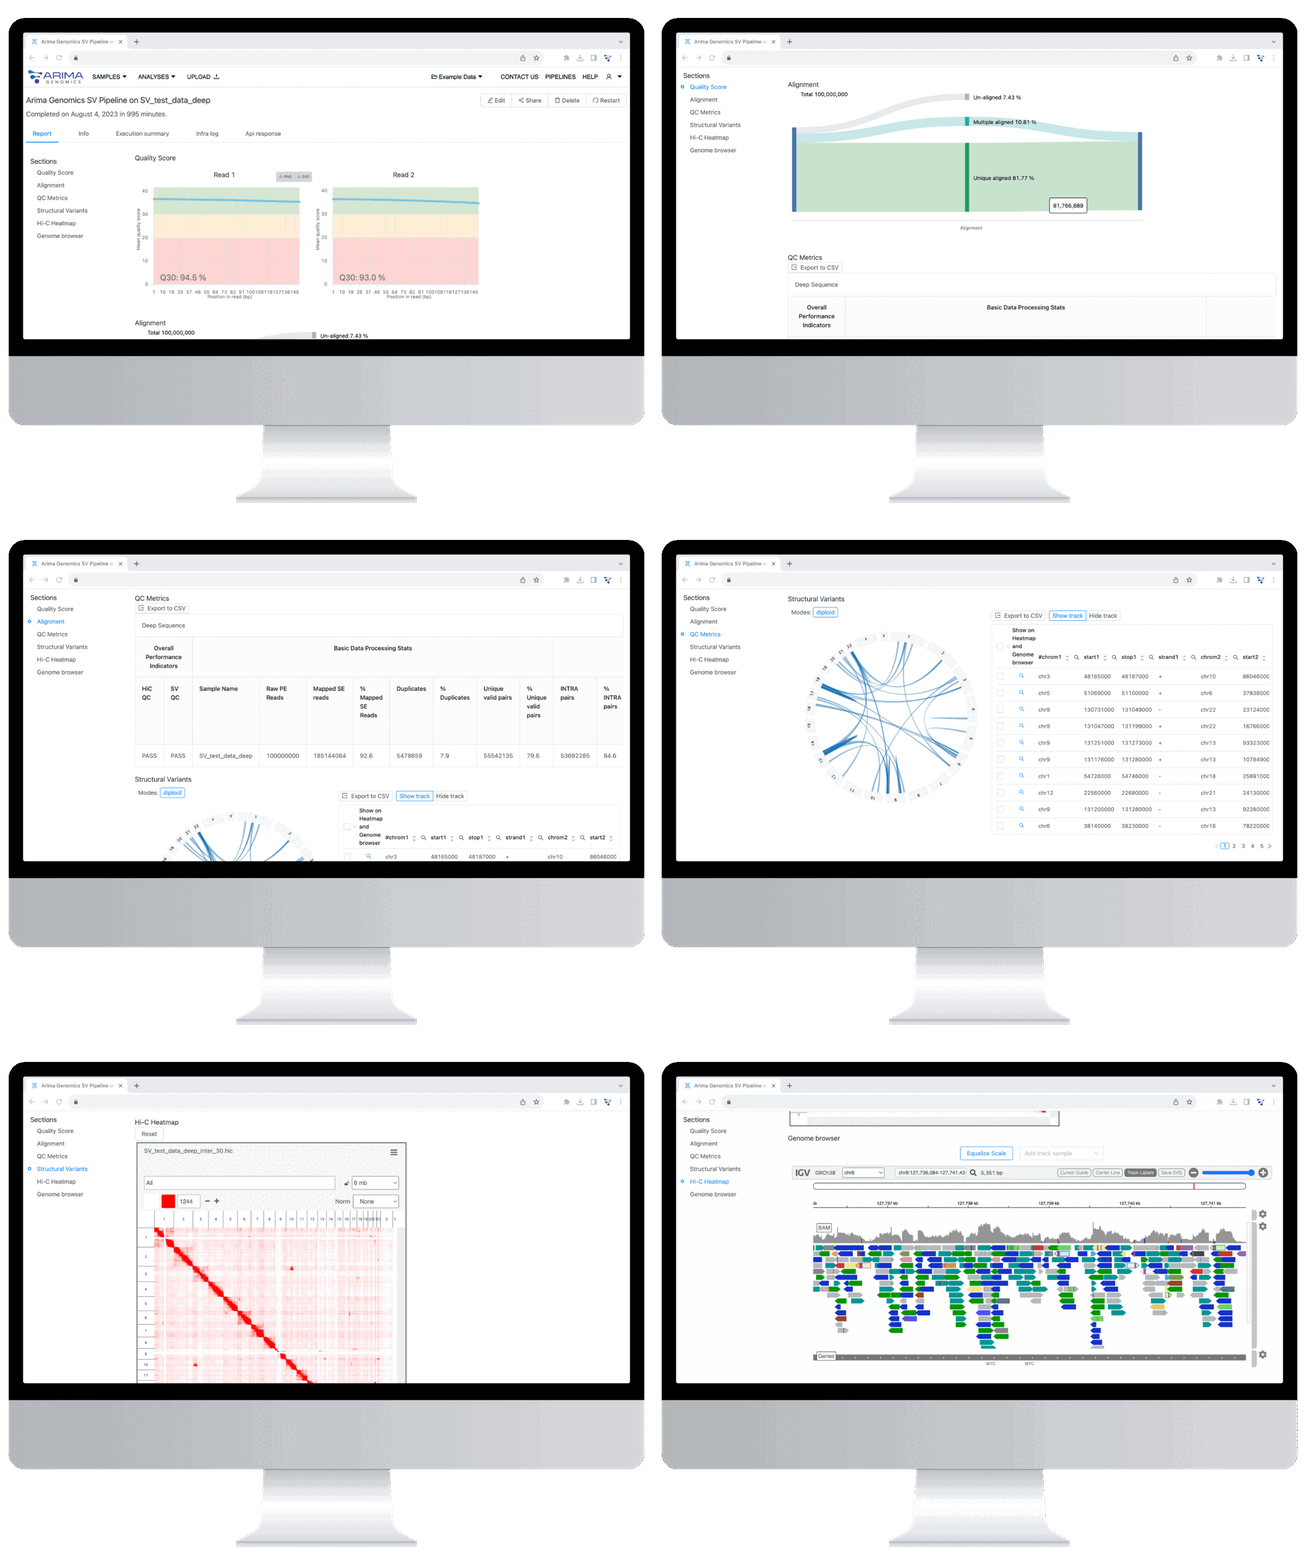
Go from FASTQ to an interactive analysis report with an interface designed for bench scientists
Interact with tables and figures directly in the report, or download them for further analysis or publication
See FAQ and get support through the Help Center
What is Generated in the SV Analysis Report?
Quality Scores
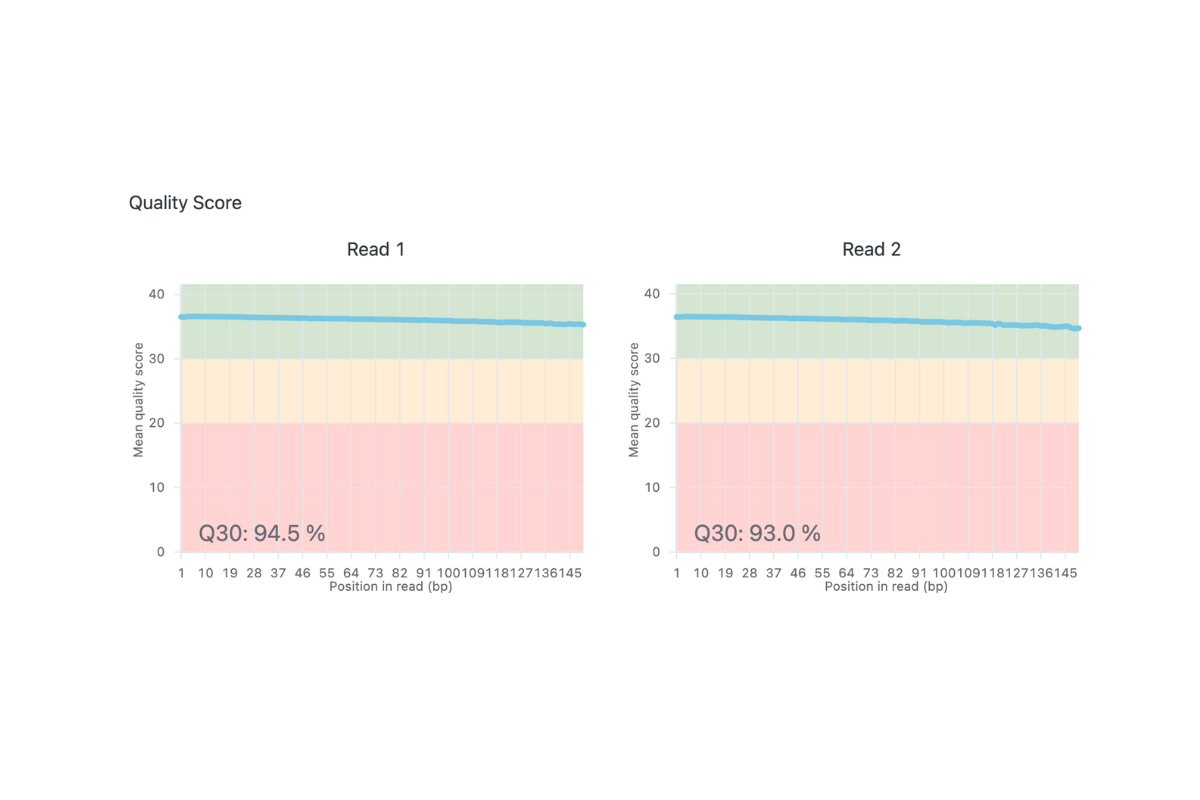
The Quality Scores graph represents the accuracy of the base calls in your sequencing data.
Alignment
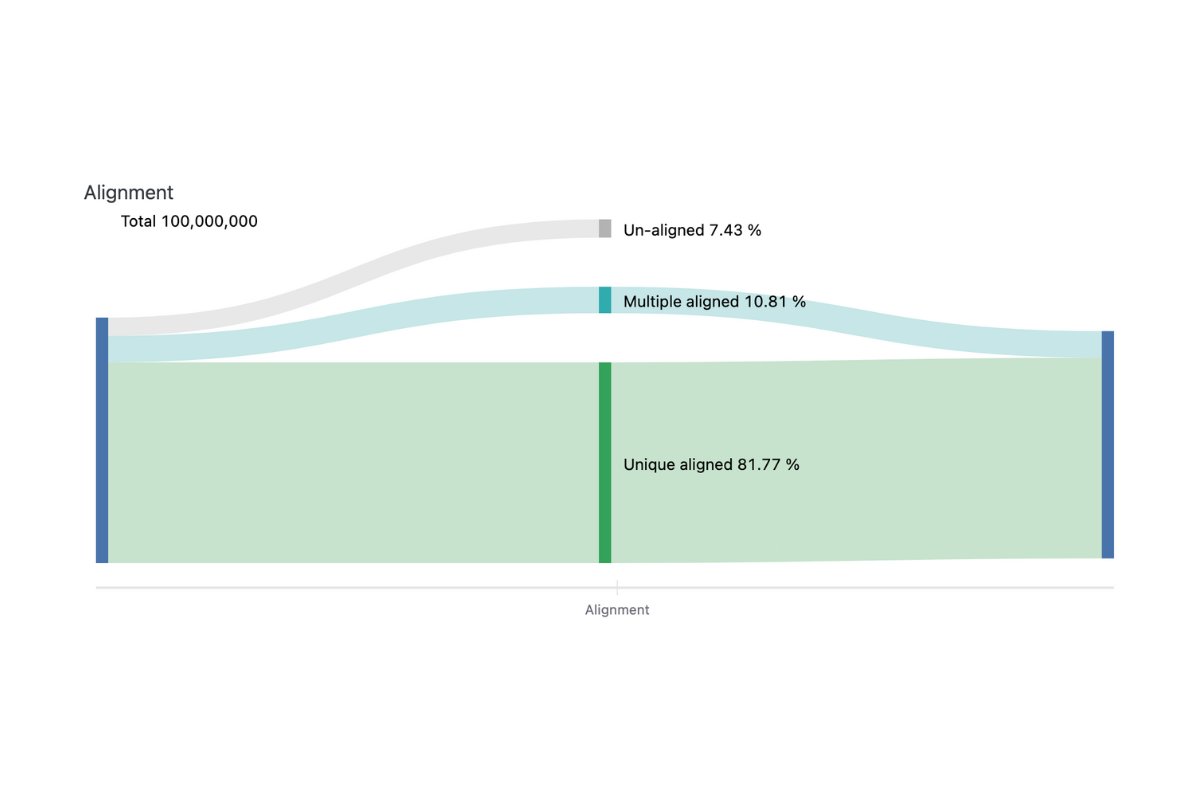
The alignment plot shows the percentage of reads that are uniquely aligned, multiple aligned, and unaligned to the reference genome.
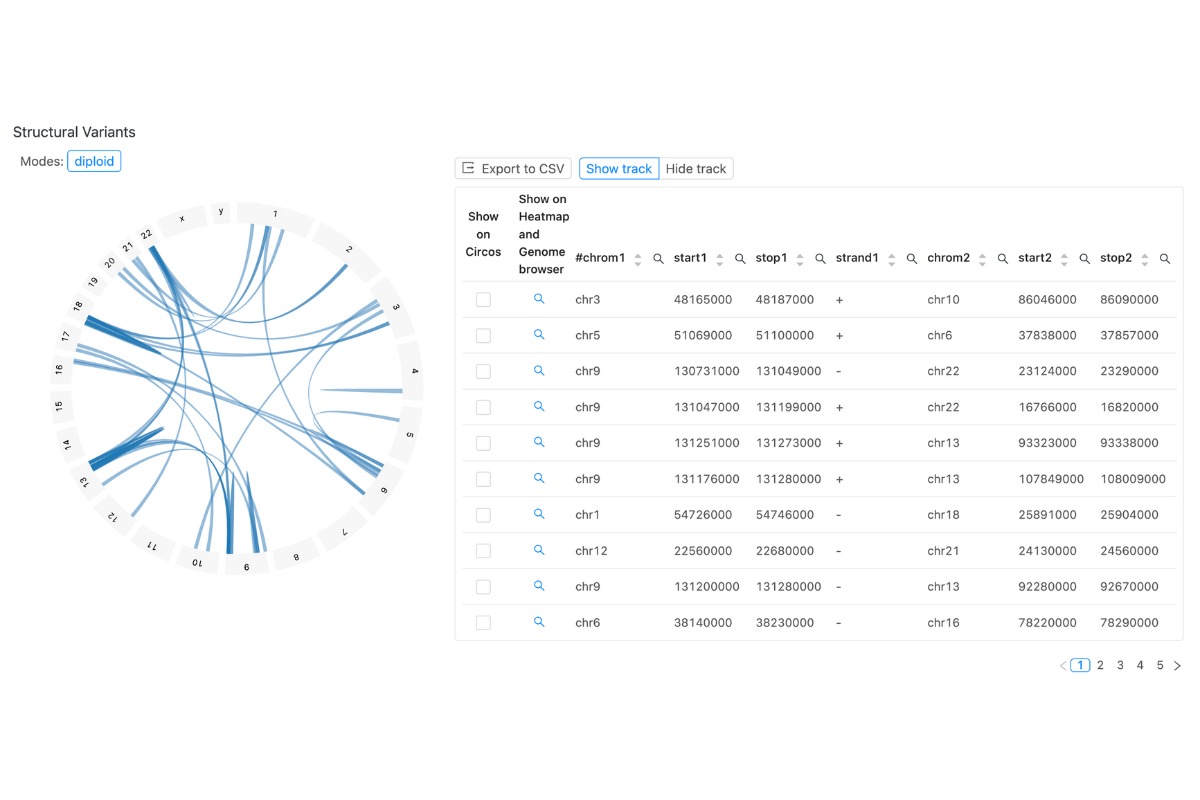
Structural Variants Table and Circos
View the list of SVs detected in your sample, and see them visually represented in an interactive circos plot.
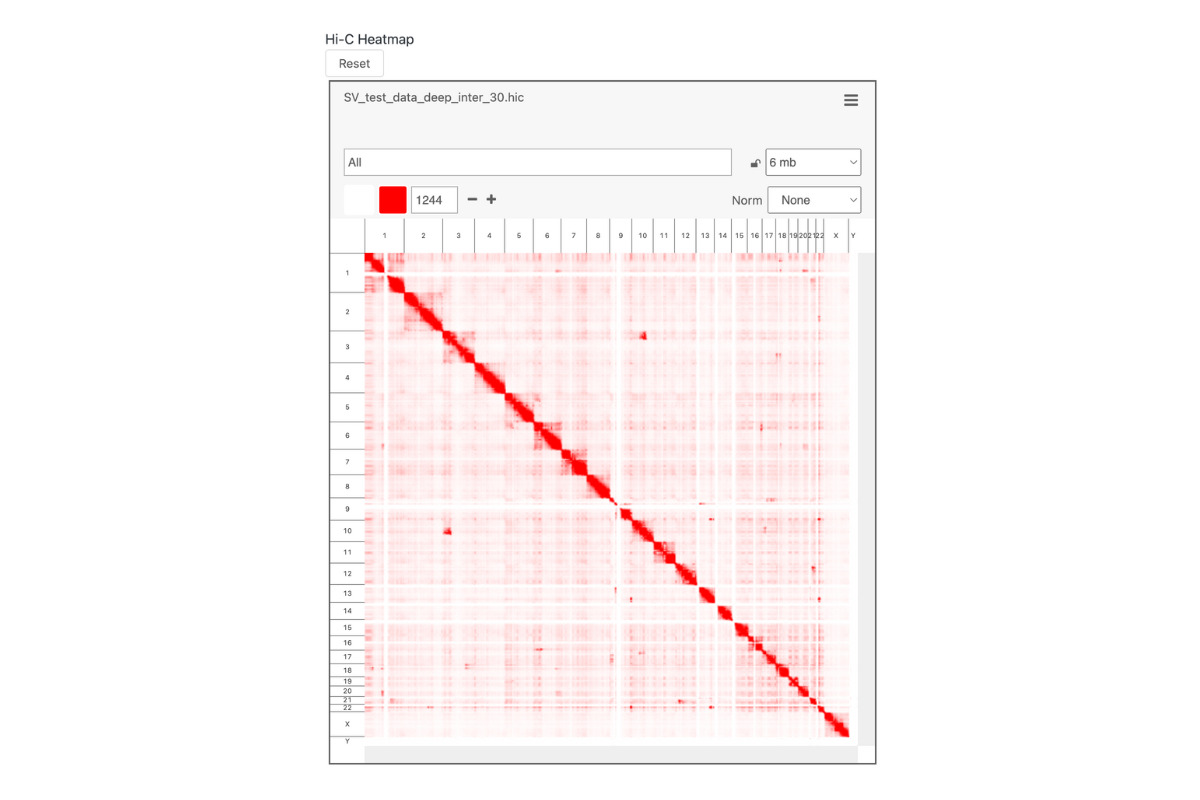
Heatmap
Visualize your SV calls through an interactive heatmap
Genome Browser
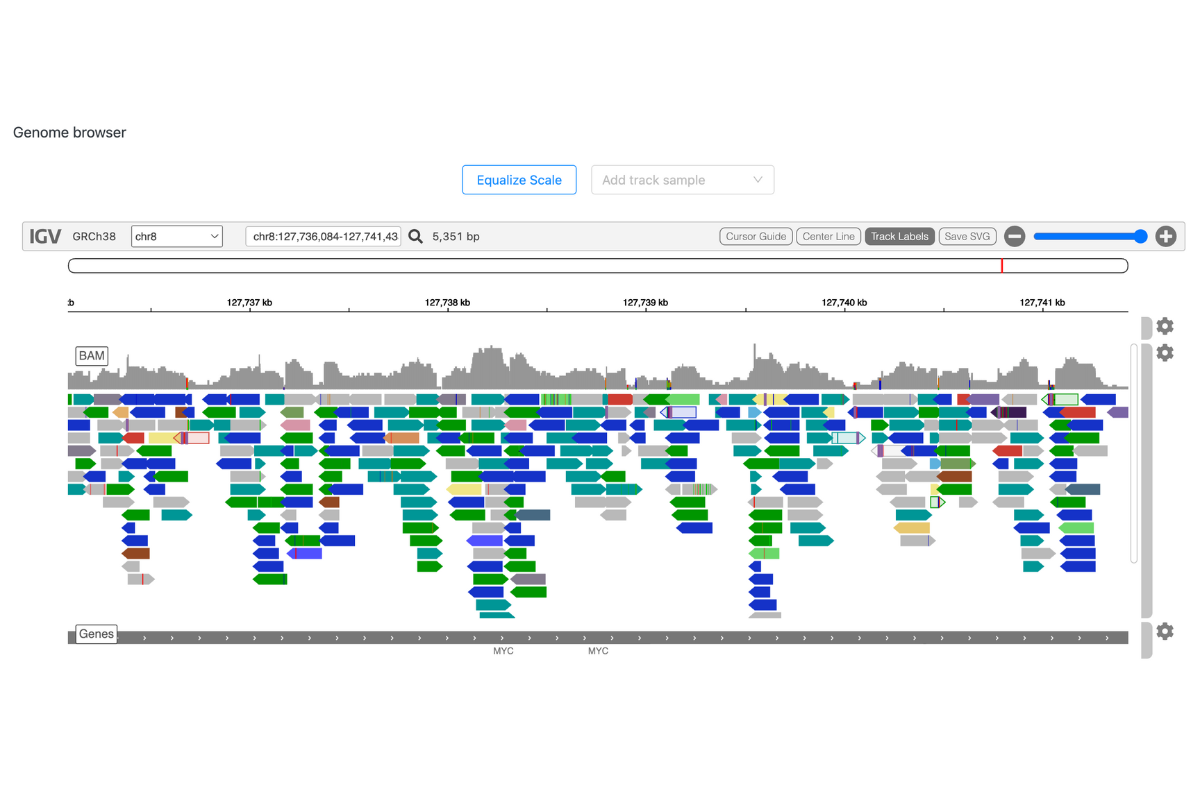
Explore your data further through the interactive IGV browser
